Day 4: Creating a Data Processing Pipeline#
Learning goals#
Organize your processing steps as single scripts to form a data processing pipeline.
Use config files to handle input parameters.
Handle errors in your code and validate input parameters.
Store your output data in a clear and consistent directory structure
Name tools for orchestration and automation of your data processing pipeline
Coding Goals#
Today we will reproduce parts of the analysis presented in the paper Mitigating heat stress by reducing solar exposure in pedestrian routing.
Use the
Routeclass from yesterday to calculate metrics for all routes generated by openrouteservice.Store the result in a
GeoPandas.geodataframeand export it a feather file.
Note
You can also export it as a geopackage, if it does not work using feather files.
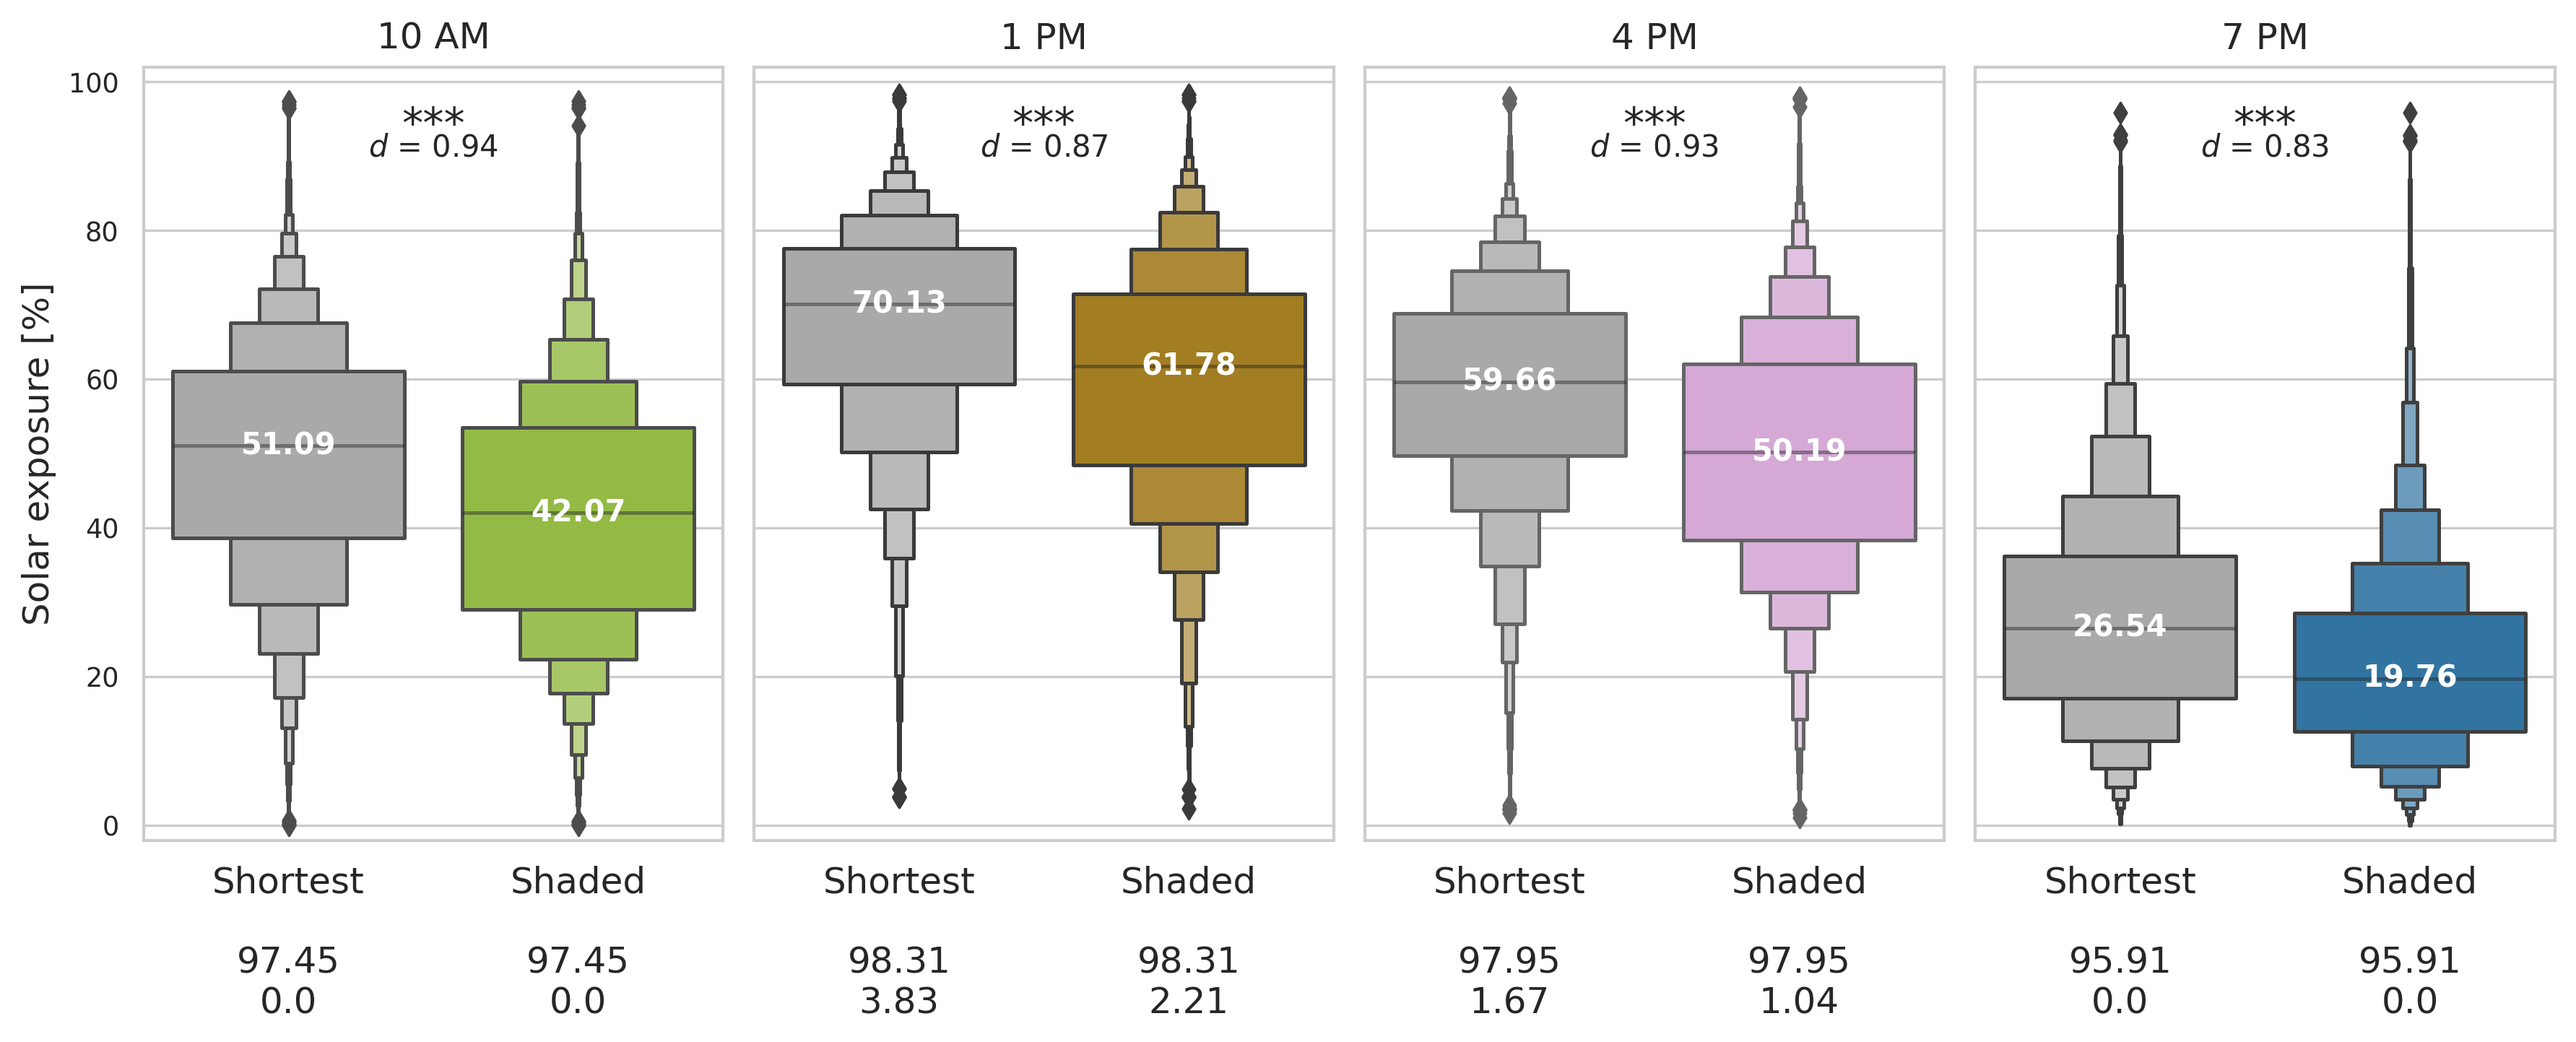
Compare the route length and mean solar exposure of the routes by creating a boxplot like this one.
Preparation#
Repository setup#
Pull the latest changes from the main branch of the Gitlab repository https://courses.gistools.geog.uni-heidelberg.de/advancedgeoscripting/advanced-geoscripting to your local repository:
git checkout main
git pull origin main
If you have local changes in your own branch that you want to keep, create commits. Otherwise, you may use git stash to temporarily remove your local changes.
Create a new branch from the main branch, using your name and the suffix
_day4for the branch name (for example: lisa_day3).
Exercises#
Create script that calculate the length and solar exposure of each route using the
Routeclass. Collect the results in aGeoDataFrame. The dataframe should have the following columns:id: The ID of the route.destination_type: The type of destination (e.g., “school”, “work”, etc.).time_of_day: The time of day when the route was generated.length: The length of the route in meters.duration: The duration of the route in seconds.solar_index: The mean solar exposure index of the route.geometry: The geometry of the route as aLineString. Tipp: Use shapely to create the geometry from the coordinates.
Write the geodataframe as a feather file to the output folder.
Note
During development of the script, only read the first 10 routes.
Create boxenplots to compare the shortest and shaded routes at different times of the day in terms of length and mean solar exposure. Use the
seabornpackage to create the plots.