New Final Assignment#
Organisational requirements#
Groups of 2 students are recommended. If you want to work on it on your own, be aware that the workload will be higher than the ECTS of the course.
Both students need to contribute equally to the code development, e.g. visible in commit history.
Estimated time working on it: ca. 80 hours. The bonus question is optional, gives extra points.
Deadline: 15th of October 2025
Note
Submission: Send us the link to your repository or branch containing the final assignment via email and indicate how many ECTS points you are seeking. [UPDATE]
5 ECTS Points#
Note
This course is worth 4 ECTS points. If you are studying the Master’s Programme in Geography, you can earn 5 ECTS for this course if you do the following:
If you do the final assignment alone, you just need to complete the main tasks described here.
If you do the final assignment in a group of 2 students, you additionally need to complete the 5 ECTS assignment.
Aim of the assignment: Reproduce our paper about the HEAL routing in Heidelberg#
We want to reproduce the analysis presented in the paper Mitigating heat stress by reducing solar exposure in pedestrian routing by Nikolaos Kolaxidis et al.
We have already done parts of it during the course. In your final assignment, you will also generate new ORS routes, so that we can see to what extent the results can be replicable. The analysis will be simplified, e.g. you don’t have to generate the pedestrian trips depending on population distribution and POIs. So we won’t be able to reproduce the exact results, but we can still answer the research questions and see how much the results differ from the original paper, i.e. how replicable the results are.
Our research question is: How much reduction in solar exposure is possible with how much detour?
Task overview#
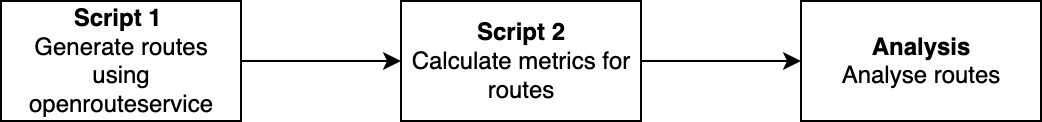
To achieve this you will build a data processing pipeline, also called ETL pipeline. The pipeline will consist of several processing steps, each implemented in a separate Python script. The scripts will be executed in a specific order to generate the final results.
After the data is processed, you will create figures to answer the research question. This can be done in a Jupyter notebook or a Python script.
Script execution and configuration files#
Each python script should be executable via the command line. Each script can be independently executed from the others. It always takes a configuration file as input, which contains the parameters controlling the data processing. The configuration file is in YAML format.
output_dir: "../data"
run_name: "run_v1"
ors_url: "https://heal.openrouteservice.org/api-iso/ors/"
number_of_routes_per_time_of_day: 10 # limit to 100
times_of_day:
  - "morning" # 10:00
  - "noon" #13:00
  - "afternoon" # 16:00
  - "evening" # 19:00
You can run the file from the repository root folder using
python ./scripts/generate_routes.py --config ./config/config_template.yaml
In Pycharm you can add the config parameter in the run configuration of the file.
Right click on the file in the project explorer and select “More run/debug options” -> “Modify run configuration”.
Add
--config ./config/config_template.yamlto the “” field in the run configuration dialog. Make sure that the relative path to the config file matches the working directory of the script in the run configuration.

A template for the config file is given in config_template.yaml.
Templates for the scripts are provided in the scripts folder.
Creating output directories#
At the start of each script, the configuration file are read and the file structure for the output files is created if it does not exist yet. The output directory is created based on the output_dir and run_name parameters in the config file.
The config file that was used to run the pipeline should be copied to the respective output directory.
Script 1: Generate routes using HEAL openrouteservice (./scripts/generate_routes.py)#
The ors_url is needed to
This scripts should generate routes using the HEAL openrouteservice for Heidelberg. The number of routes that should be created is set using the parameter number_of_routes_per_time_of_day in the config file. The routes are generated for each time of day specified in the times_of_day parameter.
The route queries need to be sent to the HEAL openrouteservice API. The URL is also given in the config file.
All ORS responses should be written to a geojson files. Use the same directory structure as the data we have provided for Heidelberg during the course.
Note
UPDATE: Optionally, you can also generate short routes as well by setting the “csv_factor” to 0. It is not mandatory though, as it was not explicity written above.
A basic code snippet to send a request to openrouteservice using the openrouteservice-py package is shown in the script ./scripts/query_openrouteservice. You need to install this package using
pip install openrouteservice
You need to extend the existing script in the following ways:
Generate as many routes as defined in the config files.
number_of_routes_per_time_of_dayis limited to 100 routes. If the user provides a higher number, the script should throw an error and exit.
Warning
Sent a maximum of 500 routing requests per script run, so we don’t collectively kill the server.
Add error handling to the request, e.g. if the request fails, catch the error using a Try-Except clause and handle it.
Start and endpoints of the routes should be randomly distributed within the administrative boundaries of Heidelberg.
Bonus: Distribute the start and endpoints based on population counts (e.g. using the census or global human settlement layer).
Script 2: Parsing ORS responses and calculating metrics#
We have already worked on this script during the block course. Take a look at the specifications from the day 4.
The ORS response that you generate with script 1 might look slightly different then the ones you’ve received during the course. So check your unit tests, if they fail when you parse the new files using the Route class. Adapt the Route class if necessary.
Your code should work with both types of ORS responses. Tipp: You could use inheritance for this.
Note
UPDATE: Add your AOI as a vector file (geopackage) to your repository so it is easier for us to check your code.
Note
You can also export it as a geopackage, if it does not work using feather files.
Analysis: Generate figures which answer the research question#
This step can be done in a Jupyter notebook or a Python script. The goal is to create figures that answer the research question: How much reduction in solar exposure is possible with how much detour?
Create two boxenplots comparing the for each time of the day the shortest and the shaded route. Compare them in regard to route length (plot 1) and solar exposure (plot 2). See the plot on exercise day 4 for an example.
Find the route pair where the shaded and shortest route have the biggest difference in length. Create one or two maps showing them. Color the routes based on the solar exposure index.
Find the route pair where the shaded and shortest route have the biggest difference in solar exposure. Create one or two maps showing them. Color the routes based on the solar exposure index.
Create one more statistical plot or map that you think is useful to answer the research question.
Note
UPDATE: 5. Add a short paragraph (about 100 to 150 words) to each figure explaining what the figure shows and what you can conclude from it.
Grading depends on how well you apply the best practices of scientific programming#
Use of functions and classes. Store them in a package and/or modules, not in your scripts. Reduce code duplication and structure your code hierarchically so it is easy to read and maintain.
Write at least one more class. For example, a class that generates the start and endpoints.
Ensure good code style and comments. Use pre-commit and ruff.
Write good documentation in your code and in your README. Use a template for this.
Provide an easy to execute example of your program in your README.
Use proper formatting in your README, e.g. use headings, lists, code blocks, etc. An image is also helpful to illustrate the goal of your program.
Set up a clear folder and file structure (see below ‘Project folder structure’). Use the directory structure similar to the one shown in directory structre
Constantly create commits throughout the development process. Both students need to create commits!
Use vectorized functions if possible.
WRITE UNIT TESTS!!!! Test your methods and functions. Test coverage should be at least 80%.
Note
Since we didn’t measure test coverage in the course, this requirement is also fulfilled if you have at least 5 tests in your code. To earn a “very good” grade, it should be more like 10 tests which are testing your code in a meaningful way.
User friendly error handling, i.e. give the user meaningful error message so they can solve the problem themselves